In brief
Dumped Items is the largest Long Beach 311 request type in every year of the city’s dataset, with 137,360 requests created since September 2020, followed by Graffiti at 84,055 and E-Scooter at 47,188. All request types together rose from 42,269 in 2021 to 70,039 in 2025, and the dataset counts 55,289 for 2026 through October 2, 2026.
- Largest types across all years shown: Dumped Items 137,360, Graffiti 84,055, E-Scooter 47,188, Street Repair 16,927, Tree Maintenance 16,4331.
- E-Scooter requests went from 311 in 2021 to 11,637 in 2024 and 10,919 in 20251.
- Street Repair requests were 4,370 in 2024 and 2,577 in 2025; Light requests rose every year, from 788 in 2021 to 2,156 in 20261.
- 2020 is partial because the dataset starts in late September, and 2026 is partial because it ends on the fetch date, October 2, 20261.
The City of Long Beach publishes the requests residents and visitors log through Go Long Beach as an open dataset, one row per request, starting in late September 20201. This page counts those rows by request type and by the year the request was created, so the figures show what gets reported and how the mix has changed. The definitions that every Data page shares are in How the Long Beach Data Pages Are Made.
Two limits apply to every column. The 2020 column is partial, because the dataset begins in late September of that year, and the 2026 column is partial, because it runs only through the fetch date. Setting either against a full year compares part of a year with a whole one.
Source Go Long Beach Service Requests, City of Long Beach open data portal, fetched October 2, 2026; daily refresh by the city. Period: September 2020 to the fetch date. Method: Every service request counted by its type and the year it was created, all statuses; the portal computed the counts. The figures are this site’s own tallies of the city’s published records, used under the City of Long Beach’s open-data terms; the city does not endorse this site. How these pages are made.
The short answer
| If you are… | Read this |
|---|---|
| Looking for the largest request type | Dumped Items, with 137,360 requests across the years shown; Graffiti is second at 84,0551 |
| Checking whether a type is growing | The year columns in the type table; E-Scooter rose from 311 in 2021 to 11,637 in 20241 |
| Comparing 2025 with 2026 | Do not compare the two directly: 2025 is a full year at 70,039, and 2026 is 55,289 through October 2, 20261 |
| Looking for a type that is not listed | The type table holds the twenty largest types; the all-requests table counts every type1 |
| Looking for how fast requests close | How Long Long Beach Takes to Close a 311 Request, by Type |
| Looking for a council district or ZIP | Long Beach 311 Requests by Council District and ZIP |
Requests by type and year
The table lists the twenty largest request types by their total, with one column for each year the request was created and a final Total row. A blank cell means the dataset has no request of that type created in that year1.
| Request type | 2020 | 2021 | 2022 | 2023 | 2024 | 2025 | 2026 | Total |
|---|---|---|---|---|---|---|---|---|
| Dumped Items | 5,663 | 18,854 | 18,802 | 19,664 | 24,429 | 27,577 | 22,371 | 137,360 |
| Graffiti | 3,380 | 13,501 | 12,861 | 12,547 | 16,042 | 16,229 | 9,495 | 84,055 |
| E-Scooter | 311 | 6,859 | 8,143 | 11,637 | 10,919 | 9,319 | 47,188 | |
| Street Repair | 403 | 1,807 | 2,018 | 3,790 | 4,370 | 2,577 | 1,962 | 16,927 |
| Tree Maintenance | 609 | 2,081 | 2,549 | 2,907 | 3,013 | 2,806 | 2,468 | 16,433 |
| Light | 170 | 788 | 918 | 1,581 | 1,667 | 1,893 | 2,156 | 9,173 |
| Sidewalk Repair | 209 | 948 | 1,120 | 1,053 | 1,309 | 1,430 | 1,222 | 7,291 |
| Dead Animal Pickup | 194 | 772 | 709 | 797 | 1,102 | 1,498 | 1,583 | 6,655 |
| Park Maintenance | 143 | 676 | 602 | 789 | 834 | 802 | 680 | 4,526 |
| Animal Services | 54 | 331 | 431 | 734 | 761 | 1,134 | 762 | 4,207 |
| Abandoned Shopping Cart | 149 | 557 | 674 | 867 | 726 | 478 | 331 | 3,782 |
| Vegetation | 72 | 285 | 438 | 823 | 702 | 554 | 689 | 3,563 |
| Report Illegal Firework | 20 | 589 | 553 | 730 | 659 | 648 | 3,199 | |
| Trash & Debris | 117 | 330 | 224 | 547 | 591 | 565 | 431 | 2,805 |
| Traffic Signal | 95 | 455 | 377 | 313 | 382 | 394 | 353 | 2,369 |
| Running Water | 55 | 169 | 239 | 173 | 176 | 186 | 176 | 1,174 |
| Shoes on a Utility Wire | 33 | 152 | 136 | 203 | 145 | 119 | 121 | 909 |
| Restroom Maintenance | 4 | 100 | 73 | 69 | 77 | 79 | 67 | 469 |
| News Rack | 17 | 65 | 50 | 27 | 45 | 54 | 8 | 266 |
| Community Center | 5 | 32 | 32 | 41 | 51 | 38 | 45 | 244 |
| Total | 11,372 | 42,234 | 49,701 | 55,621 | 68,789 | 69,991 | 54,887 | 352,595 |
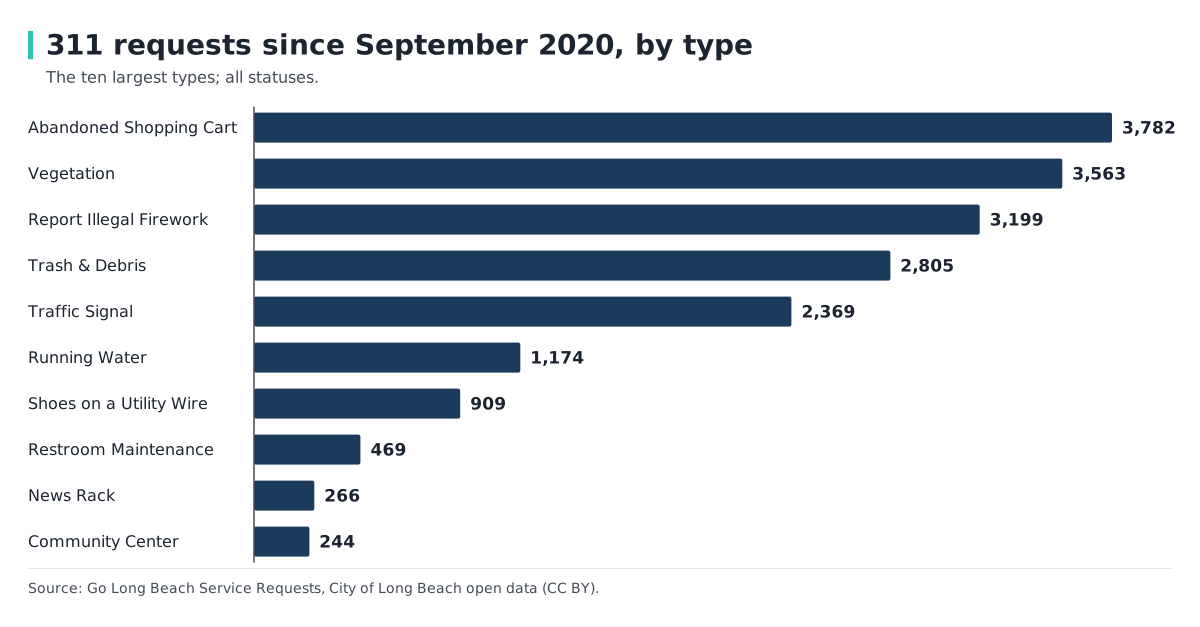
The chart shows the ten largest types over the whole period, with Dumped Items well ahead of every other bar.
Dumped Items leads with 137,360 requests, from 5,663 in 2020 to 27,577 in 2025, and it is the largest type in every year column1. Graffiti is second at 84,055 and reached 16,229 in 2025; its 2021 count of 13,501 was already close to that level1. E-Scooter is third at 47,188, a type with an empty 2020 cell, 311 requests in 2021 and 6,859 in 20221.
Below the first three, the counts drop sharply. Street Repair has 16,927 requests, Tree Maintenance 16,433, Light 9,173, Sidewalk Repair 7,291 and Dead Animal Pickup 6,6551. At the bottom of the table, Community Center has 244 requests and News Rack 2661.
Which types rose and which fell
Reading across the year columns shows several different shapes, none of which the table explains.
Steady growth. Light requests rose in every column, from 170 in 2020 to 788 in 2021, 1,893 in 2025 and 2,156 in 2026, the last of which covers only part of the year. Dead Animal Pickup went from 772 in 2021 to 1,498 in 2025 and 1,583 in 2026, also a partial year1.
A rise and a drop. Street Repair climbed from 1,807 in 2021 to 3,790 in 2023 and 4,370 in 2024, then recorded 2,577 in 2025. Abandoned Shopping Cart peaked at 867 in 2023 and stood at 478 in 2025 and 331 in 2026 to date1. The page reports these movements as the city’s counts and does not offer a cause for them.
Late arrivals. Report Illegal Firework has an empty 2020 cell, 20 requests in 2021 and 589 in 2022, after which the yearly counts stay between 553 and 7301. E-Scooter follows the same pattern of a small first year and a large second one.
Flat or shrinking. Traffic Signal went from 455 in 2021 to 313 in 2023 and 353 in 2026 to date. News Rack reached 8 in 2026, against 54 in 20251. With counts this small, a change of a few requests moves a column visibly.
Where a series jumps from one year to the next, the figures are the city’s own and the dataset does not say why; the page does not guess.
All requests by year
The type table covers the twenty largest types only. The next table counts every request in the dataset, whatever its type, by the year it was created1.
| Year | Requests |
|---|---|
| 2020 | 11,383 |
| 2021 | 42,269 |
| 2022 | 49,737 |
| 2023 | 55,679 |
| 2024 | 68,839 |
| 2025 | 70,039 |
| 2026 | 55,289 |
The yearly count was 11,383 in 2020 (a partial year), 42,269 in 2021, 49,737 in 2022 and 55,679 in 2023. It reached 68,839 in 2024 and 70,039 in 2025, the highest full-year figure in the table. For 2026 the dataset counts 55,289 requests through October 2, 20261.
These figures sit slightly above the yearly totals in the type table, because the type table leaves out requests of types outside its twenty. The type table’s 2025 total is 69,991, against 70,039 in this table, and its grand total across the years is 352,5951.
How to read these counts
Year. A request belongs to the year in which it was created, not the year it was closed1. A request created in December and closed in January counts in the earlier year.
Status. The counts include requests with every status the city records: Closed, Closed Referred, In Progress, Cancelled, Duplicate and New. A cancelled or duplicate request is in the count, which is why a type’s total here can be larger than the number of requests that ended in work being done1.
Types. The type names are the city’s labels, copied as they appear. Two labels can describe overlapping problems, and the page does not merge them.
Not rates. Nothing here is per resident or per household. A type with more requests may be a type that is easier to report, a type the city invites reporting on, or a type that happens more; the counts do not separate those.
Frequently Asked Questions
What is the most common Long Beach 311 request?
Dumped Items, with 137,360 requests created from late September 2020 through October 2, 2026. Graffiti is next at 84,055 and E-Scooter third at 47,1881.
How many 311 requests does Long Beach get in a year?
In 2025, the most recent full year, the dataset counts 70,039 requests of all types. The year before it counts 68,839, and 2023 counts 55,6791.
Why is the 2020 count so low?
The dataset starts in late September 2020, so 2020 holds only the final part of the year: 11,383 requests across all types1.
Are the 2026 numbers final?
No. The 2026 column counts requests created through October 2, 2026, the fetch date, and the statuses of recent requests can still change1.
When did e-scooter requests begin?
The type table shows 311 E-Scooter requests created in 2021 and none shown for 2020. The count was 6,859 in 2022 and 11,637 in 20241.
Does the table include every request type?
The type table lists the twenty largest types. The all-requests table counts every type, which is why its yearly figures are slightly higher1.
Where do these figures come from?
From the Go Long Beach Service Requests dataset on the city’s open data portal, tallied by this site by type and by year created1.
Related Articles
Sources
- Go Long Beach Service Requests — City of Long Beach open data portal. Accessed 2026-10-02.