In brief
The City of Long Beach’s housing dashboard data records 1,704 units at the Permitted stage in report year 2024, the highest of the seven report years from 2019 to 2025, and 951 in 2020, the lowest. Units at the Built stage range from 423 in 2019 to 1,371 in 2021, and above moderate income is the largest column in every row of both income tables.
- Permitted units by report year, 2019 to 2025: 1,261; 951; 1,071; 992; 1,011; 1,704; 1,2181.
- Built units by report year, 2019 to 2025: 423; 737; 1,371; 1,006; 1,215; 1,204; 9051.
- Very low income units at the Permitted stage: 87 in 2019, 0 in 2020, 83 in 2021, 98 in 2022, 102 in 2025; Low income units: 326 in 2022 and 214 in 20241.
- The stages are the city’s report stages (Planning Application, Entitled, Building Application, Permitted, Built) and are never added together, because one project can appear in several1.
Every year the City of Long Beach reports its housing activity in a Housing Element annual progress report, and the project rows behind those reports are published as the Housing Dashboard Data layer on MapsLB, the city’s open data hub1. This page tallies that layer by report year, by stage and by income level, so one table can answer how many units the city recorded as permitted and how many as built. The definitions behind every Data page are in How the Long Beach Data Pages Are Made.
The layer is published under the MapsLB terms of use, which allow reuse of the data, and this site attributes it to the city and claims no endorsement2. The figures are the city’s records of projects, as reported; they are not a count of homes standing in the city, and they are not a forecast of anything1.
Source Housing Dashboard Data 2019-2025 (Housing Element Annual Progress Reports), City of Long Beach (MapsLB), fetched October 1, 2026; yearly refresh by the city. Period: 2019 to 2025. Method: Units summed from the city’s Housing Element Annual Progress Report rows by report year and stage; a project appears in every stage it reached in a year, so stages are not added together. Permitted units by the income category the report assigns (very low, low, moderate, above moderate). The figures are this site’s own tallies of the city’s published records, used under the City of Long Beach’s open-data terms; the city does not endorse this site. How these pages are made.
The short answer
| If you are… | Read this |
|---|---|
| Looking for units permitted in a year | The Permitted column of the stage table: 1,704 in 2024, the highest, and 951 in 2020, the lowest1 |
| Comparing permitted with built | They are separate stage counts, not a pipeline; in 2021 the layer shows 1,071 Permitted and 1,371 Built1 |
| Looking for lower-income units | The Very low and Low columns of the income tables; Low reached 326 permitted in 20221 |
| Tempted to add the stages together | Do not: one project can be in several stages, so the sum counts the same units more than once1 |
| Looking for the rules behind a permit | Permits in Long Beach and What Needs a Building Permit in Long Beach |
| Looking for another Data page | Long Beach 311 Requests by Type and Year Since 2020 |
Units by report year and stage
The layer holds one row per project per stage per report year. The stage table sums the units of every row in a stage for a report year, so each column is a separate count with its own meaning: Planning Application, Entitled, Building Application, Permitted and Built are the city’s own stage names1.
| Report year | Planning Application | Entitled | Building Application | Permitted | Built |
|---|---|---|---|---|---|
| 2019 | 1,225 | 927 | 1,070 | 1,261 | 423 |
| 2020 | 1,392 | 1,109 | 572 | 951 | 737 |
| 2021 | 628 | 345 | 1,449 | 1,071 | 1,371 |
| 2022 | 3,070 | 657 | 423 | 992 | 1,006 |
| 2023 | 1,978 | 2,934 | 1,914 | 1,011 | 1,215 |
| 2024 | 1,123 | 1,788 | 1,529 | 1,704 | 1,204 |
| 2025 | 622 | 366 | 1,436 | 1,218 | 905 |
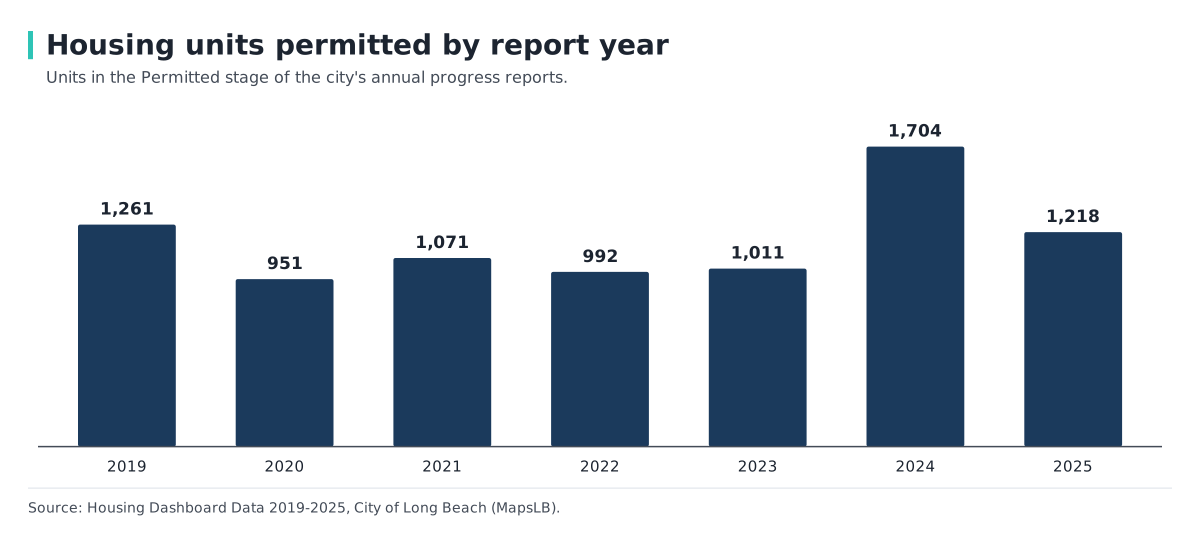
The chart shows units at the Permitted stage for each report year, from 951 in 2020 to 1,704 in 2024.
The Permitted column is the stage most people mean by housing production. It reads 1,261 in 2019, 951 in 2020, 1,071 in 2021, 992 in 2022 and 1,011 in 2023. It then reaches 1,704 in 2024 and 1,218 in 20251.
The Built column records units the reports show as completed. It reads 423 in 2019, 737 in 2020 and 1,371 in 2021, the highest of the seven years, then 1,006 in 2022, 1,215 in 2023, 1,204 in 2024 and 905 in 20251.
The earlier stages swing more. Planning Application reached 3,070 in 2022 and stood at 622 in 2025. Entitled reached 2,934 in 2023 and 345 in 2021. Building Application peaked at 1,914 in 2023 and was lowest in 2022, at 4231.
Why the stages are not added together
A project can appear at more than one stage, and in more than one stage in the same report year. A project that is Entitled in one report year and Permitted in the next is counted once in each of those columns, so a total across stages would count its units twice or more1.
For the same reason, a Built figure higher than a Permitted figure in the same row is not an error. In 2021 the Built column reads 1,371 and the Permitted column 1,071; in 2023 the two read 1,215 and 1,011; in 2019 they read 423 and 1,2611. Each column is its own count of project rows in that stage, not a running balance.
The report year is the label the layer gives each row, the annual progress report it belongs to. The page does not convert report years to calendar years or fiscal years1.
Units permitted by income level
The income columns are the city’s four categories: Very low, Low, Moderate and Above moderate. The page does not define the income limits behind each category; they are the city’s categories, as the layer records them. The All units column is the layer’s own total-units field, which can differ from the sum of the four income columns; in the rows below the two agree1.
| Report year | Very low | Low | Moderate | Above moderate | All units |
|---|---|---|---|---|---|
| 2019 | 87 | 108 | 11 | 1,055 | 1,261 |
| 2020 | 0 | 39 | 0 | 912 | 951 |
| 2021 | 83 | 4 | 0 | 984 | 1,071 |
| 2022 | 98 | 326 | 0 | 568 | 992 |
| 2023 | 0 | 0 | 0 | 1,011 | 1,011 |
| 2024 | 28 | 214 | 0 | 1,462 | 1,704 |
| 2025 | 102 | 31 | 0 | 1,085 | 1,218 |
Above moderate income units are the largest column in every row, from 568 in 2022 to 1,462 in 20241. In 2023 all 1,011 permitted units sit in that column, and the other three show 0.
Very low income permitted units are 87 in 2019, 0 in 2020, 83 in 2021 and 98 in 2022, then 0 in 2023, 28 in 2024 and 102 in 2025. Low income units are 108 in 2019, 39 in 2020 and 4 in 2021, then 326 in 2022, 0 in 2023, 214 in 2024 and 31 in 20251. Moderate income units show 11 in 2019 and 0 in every other report year1.
Units built by income level
The same four categories apply to units at the Built stage1.
| Report year | Very low | Low | Moderate | Above moderate | All units |
|---|---|---|---|---|---|
| 2019 | 0 | 0 | 0 | 423 | 423 |
| 2020 | 0 | 159 | 0 | 578 | 737 |
| 2021 | 152 | 90 | 0 | 1,129 | 1,371 |
| 2022 | 0 | 0 | 0 | 1,006 | 1,006 |
| 2023 | 76 | 88 | 14 | 1,037 | 1,215 |
| 2024 | 87 | 69 | 0 | 1,048 | 1,204 |
| 2025 | 40 | 152 | 0 | 713 | 905 |
Above moderate income units again make up the largest column, from 423 in 2019 and 578 in 2020 to 1,129 in 2021, 1,048 in 2024 and 713 in 20251. Very low income units show 0 in 2019, 2020 and 2022, 152 in 2021, 76 in 2023, 87 in 2024 and 40 in 20251.
Low income units show 0 in 2019 and 159 in 2020, then 90 in 2021, 0 in 2022, 88 in 2023, 69 in 2024 and 152 in 2025. Moderate income units appear once, as 14 in 20231. A 0 in these tables is what the layer shows for that cell; the page does not say whether it means none were built or none were reported.
How to read these figures
Units, not projects or buildings. Every figure counts housing units, the unit of the city’s report1.
Stages. The five stages are the city’s report stages. Read one stage at a time, and compare a stage with itself across years rather than with another stage1.
All units. The All units column is the layer’s total, and the page shows it beside the four income columns for each stage1.
Report years. The layer covers report years 2019 to 2025. The city adds the next report year when it posts it, and this page is rebuilt from the current layer when that happens1.
Frequently Asked Questions
How many housing units does Long Beach permit each year?
The city’s housing dashboard data shows 1,261 units at the Permitted stage in report year 2019, 951 in 2020, 1,071 in 2021, 992 in 2022, 1,011 in 2023, 1,704 in 2024 and 1,218 in 20251.
What does Permitted mean in the Long Beach housing data?
It is one of the city’s report stages. The page sums the units of every project row recorded in the Permitted stage for each report year1.
Why are there more units built than permitted in some years?
Each stage is a separate count of project rows for that report year, not a running balance. In 2021 the layer shows 1,371 Built and 1,071 Permitted1.
Can the stage columns be added up for a total?
No. A project can appear in several stages and more than once in a year, so adding the stages counts the same units more than once1.
How many very low income units were permitted?
87 in report year 2019, 0 in 2020, 83 in 2021, 98 in 2022, 0 in 2023, 28 in 2024 and 102 in 20251.
What is a report year?
It is the annual progress report year the layer assigns to each row. The page does not convert it to a calendar year1.
Can these figures be reused?
The layer is published under MapsLB’s terms of use, which allow reuse of the data without implying the city’s endorsement2.
Related Articles
Sources
- Housing Dashboard Data 2019-2025 — City of Long Beach, MapsLB. Accessed 2026-10-01.
- Terms of Use — City of Long Beach, MapsLB. Accessed 2026-09-30.