In brief
The city’s list of business improvement districts has ten rows, though the page’s own text says “nine”, and each district assesses by its own method: base fees plus per-employee amounts for merchants, rates per property measure for property owners, and 3 percent of room revenue for large hotels. The city’s license FAQ says “Businesses located within a Business Improvement District (BID) will have to pay an additional annual fee”.
- The BID Association “receives 100% of the revenues collected”; the city “assists with the collection”1.
- Merchant districts print rates by license category: for example Belmont Shore Retail-Other is $685.91 plus $10.31 per employee in its FY 2023-24 report3.
- Property districts (Downtown PBID, Midtown, Uptown) assess the property, by zone rate or “special benefit points”456.
- The Tourism BIA is “three percent (3%) of the gross short term room rental revenue” for hotels with more than 30 rooms7.
- MapsLB hosts three BID layers; the layers’ fields could not be read, so the Business License Division is the stated route for an address28.
A business improvement district is a second charge that rides on the first. The city license is a tax on the business; a BID assessment is billed on top of it, to merchants or to property owners, and goes to the district’s association. This page lists the districts on the city’s table, what each BID’s own report says it assesses and for which year, and where to check an address. The costs the city itself charges are in What a Long Beach Business License Costs, and the section pillar is How to Start a Business in Long Beach.
The short answer
| If you are… | Do this |
|---|---|
| A merchant opening in a commercial corridor | Ask the Business License Division whether the address is inside a BID: (562) 570-6211 or [email protected]2 |
| A property owner in Downtown, Midtown or Uptown | The property BIDs assess the parcel; the rate tables are below456 |
| A hotel with more than 30 rooms | The Tourism BIA levies 3 percent of gross short-term room rental revenue7 |
| On Santa Fe Avenue between Anaheim and Willow Streets | The city describes the corridor as a place it is “actively engaging”, not as a district9 |
What the city says a BID is
BIDs “offer the chance for property and business owners to join together to pool funds to be used for agreed upon improvements in their respective business districts”, delivering services “above and beyond the baseline services provided by the City”. The services “generally include” business expansion, attraction and retention, marketing and special events, place making and beautification, public safety and hospitality, and street cleaning and maintenance1.
The city “enters into agreements with non-profit organizations (BID Associations)”; each association’s board serves as the “Advisory Board” to the City Council and files an annual report with recommended assessment rates, programs and budget, which Council approves. Funding is “a special assessment billed to merchants or property owners within a district”, and “The methodology used to quantify assessments are unique to each BID”1.
Official pages disagree The city’s BID page says “There are nine BIDs within Long Beach”, but its table has ten rows, because the two Downtown BIDs and the two Tourism BIAs are listed separately1. This page follows the table, with the two Tourism BIAs shown as one row.
What each BID assesses
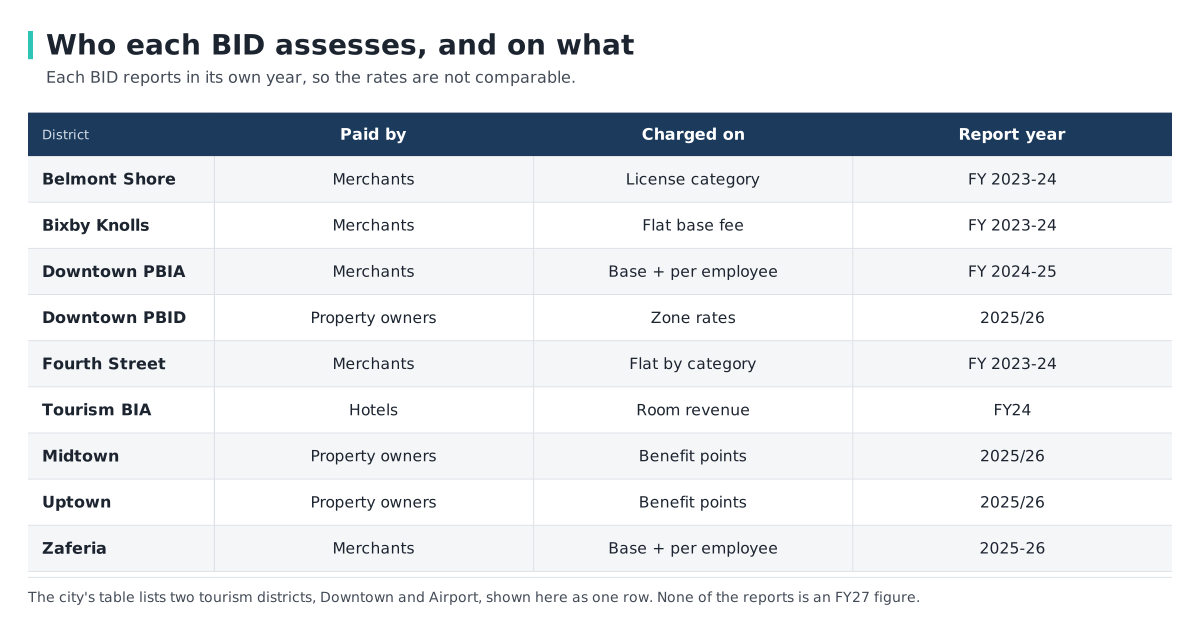
Each row is the BID’s own report, in the year shown. The years differ, none is an FY27 figure, and the structures differ, so the amounts are not comparable across districts1.
| BID | Type on the city’s table | Assessment terms |
|---|---|---|
| Belmont Shore | PBIA (merchant) | FY 2023-24 report, by license category: Retail-Other $685.91 + $10.31 per employee; Retail-Restaurant with alcohol and ready-to-eat $800.23 + $12.03; Service-Other $399.18 + $20.62; Construction Contractor $532.25 + $27.50; non-profits $0. No change proposed3 |
| Bixby Knolls | PBIA (merchant) | FY 2023-24 report: “The current annual base assessment for businesses is $520. Nonprofits are assessed a base fee of $260.” Adjustments for CPI are at the board’s discretion10 |
| Downtown Long Beach PBIA | merchant | Rate sheet for July 1, 2024 to June 30, 2025 (FY 2024-25): Retail, Services, Contractors and Professionals $548.58 + $9.07 per employee; Independent Contractor $376.74 + $6.2711 |
| Fourth Street | PBIA (merchant) | FY 2023-24 report: $200 a year for most license categories (retail, services, contractors, professional, banking); $100 for miscellaneous (recreation, vending, manufacturing, wholesale), commercial space rental and non-profits12 |
| Zaferia | PBIA (merchant) | 2025-26 report. Type 1 (retail, recreation and entertainment, unique, banking): base $375 plus $15 per employee, up to $300 maximum. Type 2 (service, vending, professional, wholesale, contractor, manufacturing, mobile): base $250 plus $15 per employee, up to $300. Type 3 (non-residential space rental) $150; Type 4 (non-profit) $100; Type 5 (voluntary home-based members) $100. “Residential property rental is exempt.”13 |
| Midtown | PBID (property) | 2025/26 report: assessed by “special benefit points”; rate per point $157.62463 for 2025/26 (maximum $163.92961), $151.56214 for 2024/255 |
| Uptown | PBID (property) | 2025/26 report: per special benefit point $55.75424 for 2025/26 (a 4.00% increase), $53.60985 for 2024/256 |
| Long Beach Tourism BIA, Downtown and Airport | hotels | FY24 report: “levied on all hotel businesses, existing and future, with greater than thirty (30) rooms … three percent (3%) of the gross short term room rental revenue”, collected monthly7 |
The Downtown Long Beach PBID, the property district, has its own table: 2025/26 rates by zone4.
| Downtown PBID item | Standard Zone | Premium Zone |
|---|---|---|
| Frontage | $18.9865 | $26.5078 |
| Commercial | $0.0681 | $0.0753 |
| Parking Structure | $0.0448 | $0.0521 |
| Public/Non-Profit | $0.0216 | $0.0288 |
| Residential under 50 units | $0.0216 | $0.0288 |
| Residential 50+ units | $0.0333 | $0.0404 |
Source:4. The report says “the PBID Board approved a rate increase of 5%” and that maximum rates rise 5 percent a year; the units behind the rates, such as a charge per square foot, are not stated in the text of the report. The Tourism BIA’s fee text sits under a “2022-2023” heading inside its FY24 report, so whether the rate has changed since is not confirmed for FY277.
How to know whether an address is inside one
The city’s license FAQ says: “Businesses located within a Business Improvement District (BID) will have to pay an additional annual fee. More information can be found on our Taxes & Fees page or you may call us at (562) 570-6211 or email us at [email protected]”2. The merchant rate sheets are keyed to the license categories the city uses (Retail, Services, Contractors, Professionals and so on)11. The city’s BID page also links each district’s fee sheet and boundary map, and a council-district BID map1.
Where to check MapsLB (maps.longbeach.gov) hosts three public layers titled “Business Improvement Districts”, “Merchant BID” and “Property BID”81415. The pages run on scripts; the layer titles are readable, and the Merchant BID layer repeats the city’s BID description, but the layers’ field names and update dates could not be read. Whether a layer can be searched by address was not confirmed; which fee applies still comes from the district’s own sheet or the Division.
Some corridors have no BID. The Economic Development and Opportunity bureau is “actively engaging with businesses along the Santa Fe Avenue business corridor, from Anaheim to Willow Streets” and exploring “a new business association dedicated to Retail Trade and Accommodation & Food Services on the Westside”; the existing Westside Business Association “primarily serves the industrial area”9.
Frequently Asked Questions
How many business improvement districts are in Long Beach?
The city’s page says “nine”, but its table lists ten rows, counting the two Downtown BIDs and the two Tourism BIAs separately1.
Who receives the money from a BID?
“The BID Association receives 100% of the revenues collected”; the city “assists with the collection”1.
Do businesses inside a BID pay more than the license tax?
Yes. The city says they “will have to pay an additional annual fee”2.
How much is the Belmont Shore BID assessment for a retailer?
In the FY 2023-24 report, Retail-Other is $685.91 plus $10.31 per employee3.
How is the Downtown property BID assessed?
By zone rates for frontage, commercial space, parking structures, public and non-profit space and residential units, in a Standard Zone and a Premium Zone4.
Are hotels assessed?
Hotels with more than 30 rooms pay the Tourism BIA’s 3 percent of gross short-term room rental revenue7.
How do I find out if my address is in a BID?
Related Articles
Sources
- Business Improvement Districts — City of Long Beach, Economic Development and Opportunity. Accessed 2026-10-02.
- Business License Frequently Asked Questions — City of Long Beach, Financial Management. Accessed 2026-10-02.
- Belmont Shore PBIA Annual Report, FY 2023-24 — Belmont Shore Business Association, via City of Long Beach. Accessed 2026-10-02.
- Downtown Long Beach PBID Annual Report, 2025/26 — Downtown Long Beach Alliance, via City of Long Beach. Accessed 2026-10-02.
- Midtown PBID Annual Report, 2025/26 — Midtown Property and Business Owner’s Association, via City of Long Beach. Accessed 2026-10-02.
- Uptown PBID Annual Report, FY 2025-26 — Uptown Property and Community Association, via City of Long Beach. Accessed 2026-10-02.
- Long Beach Tourism BIA Annual Report, FY24 — Visit Long Beach, via City of Long Beach. Accessed 2026-10-02.
- Business Improvement Districts (MapsLB layer) — City of Long Beach, MapsLB. Accessed 2026-10-02.
- Santa Fe Avenue Business Corridor — City of Long Beach, Economic Development and Opportunity. Accessed 2026-10-02.
- Bixby Knolls PBIA Annual Report, 2023-2024 — Bixby Knolls Business Improvement Association, via City of Long Beach. Accessed 2026-10-02.
- Downtown Long Beach PBIA Rate Sheet, FY 2024-25 — Downtown Long Beach Alliance, via City of Long Beach. Accessed 2026-10-02.
- Fourth Street PBIA Annual Report, FY 2023-24 — Fourth Street Business Improvement Association, via City of Long Beach. Accessed 2026-10-02.
- Zaferia Annual Report, 2025-2026 — Zaferia Business Association, via City of Long Beach. Accessed 2026-10-02.
- Merchant BID (MapsLB layer) — City of Long Beach, MapsLB. Accessed 2026-10-02.
- Property BID (MapsLB layer) — City of Long Beach, MapsLB. Accessed 2026-10-02.