In brief
A closed record in the City of Long Beach’s license layer is an account the city closed on that date, not a business that failed; counted that way, the layer shows between 206 and 370 in-city closures in a month over the last two years, and 252 in September 2026. By category group, closures run from 2,094 in 2022 to 4,242 in 2024 and 3,465 in 2025, with 2,696 through September 2026.
- Most closures in a month: February 2026, 370 records; April 2026 follows with 363 and April 2025 with 3411.
- Fewest in a month: November 2024, 206 records, then December 2024 with 2311.
- Largest group since 2022: Professional and office with 3,465 closures, then Property rental with 2,4961.
- The yearly total jumped from 2,306 in 2023 to 4,242 in 2024 and then came down to 3,465 in 20251.
- The counts are as of October 1, 2026; the current month is left out and the previous two months are provisional1.
A closed business license record is an account the City of Long Beach closed on a given date. It is not a business failure. A closed account can reflect a business that stopped operating, but it can also reflect a holder who moved, stopped paying or changed entity, and the date the city records can be well after trading ended1. A table of closures therefore measures what happened to the register, not what happened to businesses on the street.
With that definition in place, the page counts closed in-city records by the month the city closed them, with a split into home-based and not home-based, and by category group and year from 2022. The opening side of the register is on New Business Licenses in Long Beach, Month by Month, and the process the city’s business licensing starts with is in How to Start a Business in Long Beach. The definitions behind every figure are on How the Long Beach Data Pages Are Made. The numbers are this site’s tallies of the city’s records, used under the MapsLB terms of use, which allow reuse and do not allow any suggestion that the city endorses it2.
Source Business Licenses Public View, City of Long Beach (MapsLB), fetched October 1, 2026; nightly refresh by the city. Period: October 2024 to September 2026; Professional and office to Sidewalk vending. Method: In-city license records whose current milestone is Closed, counted by the month of that milestone’s date; a record closes when the city closes the account, which can be long after the business stopped. The figures are this site’s own tallies of the city’s published records, used under the City of Long Beach’s open-data terms; the city does not endorse this site. How these pages are made.
The short answer
| If you are… | Read this |
|---|---|
| Looking for how many license accounts the city closed in a month | The month table; the latest full row, September 2026, shows 2521 |
| Looking for the busiest month for closures | February 2026, with 370 records1 |
| Asking whether a closure means a business failed | No; the record is the date the city closed the account1 |
| Looking for the categories with the most closures | Professional and office with 3,465 and Property rental with 2,496 since 20221 |
| Checking a year against another | The group table; 2024 has 4,242 closures and 2023 has 2,3061 |
What a closure is in this data
The city’s layer gives each record a milestone and a milestone date. This page counts records whose current milestone is “Closed”, in the month of the milestone date1. The milestone date is the date of the last status change the city recorded, so a closure date is the day the account was closed, which can be long after the business stopped trading1.
Three consequences matter when reading the tables. A record closed for non-payment counts the same as one closed because the business ended. A record that has been closed and later reopened is no longer counted, because its milestone is no longer “Closed”. And only in-city records are counted; licensees located outside the city are left out1.
The current month, October 2026, is left out, and the two months before it, August and September 2026, are provisional: they can change when the table is rebuilt1.
Closures by month
The table shows the twenty-four months from October 2024 to September 2026. Each row gives the in-city records closed that month, split into home-based and not home-based.
| Month | Home-based | Not home-based | Total |
|---|---|---|---|
| 2024-10 | 86 | 239 | 325 |
| 2024-11 | 58 | 148 | 206 |
| 2024-12 | 64 | 167 | 231 |
| 2025-01 | 81 | 161 | 242 |
| 2025-02 | 80 | 180 | 260 |
| 2025-03 | 86 | 183 | 269 |
| 2025-04 | 117 | 224 | 341 |
| 2025-05 | 77 | 221 | 298 |
| 2025-06 | 70 | 169 | 239 |
| 2025-07 | 51 | 263 | 314 |
| 2025-08 | 73 | 210 | 283 |
| 2025-09 | 88 | 214 | 302 |
| 2025-10 | 70 | 268 | 338 |
| 2025-11 | 52 | 194 | 246 |
| 2025-12 | 114 | 219 | 333 |
| 2026-01 | 146 | 191 | 337 |
| 2026-02 | 109 | 261 | 370 |
| 2026-03 | 57 | 230 | 287 |
| 2026-04 | 86 | 277 | 363 |
| 2026-05 | 75 | 236 | 311 |
| 2026-06 | 63 | 186 | 249 |
| 2026-07 | 51 | 205 | 256 |
| 2026-08 | 62 | 209 | 271 |
| 2026-09 | 45 | 207 | 252 |
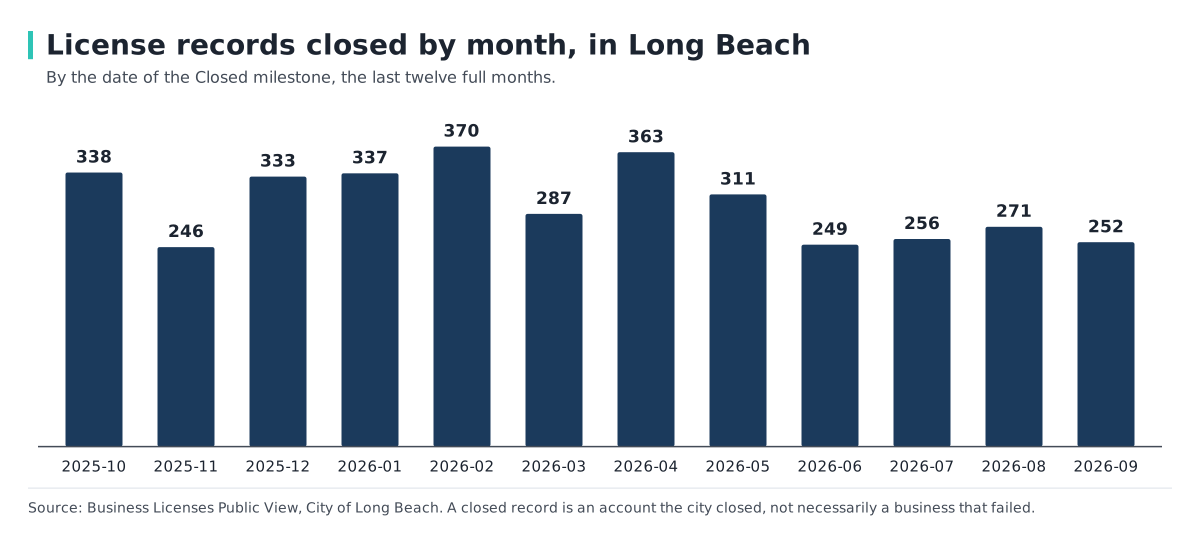
The chart shows the last twelve full months of the table, October 2025 through September 2026, one bar per month.
Closures stay in a band for most of the twenty-four months. The highest month is February 2026 with 370 closures, of which 109 are home-based and 261 are not1. April 2026 has 363 and April 2025 has 3411. October 2025 has 338, January 2026 has 337 and December 2025 has 3331.
The lowest month is November 2024, with 206 closures, then December 2024 with 231 and June 2025 with 2391. In the twelve-month chart, the lowest is November 2025 with 246, followed by June 2026 with 249 and September 2026 with 2521.
The not home-based column carries most of the count in every month. It peaks at 277 in April 2026 and bottoms at 148 in November 20241. Home-based closures are spikier. They reach 146 in January 2026 and 114 in December 2025, and fall to 51 in July 2025 and July 2026, 52 in November 2025 and 45 in September 2026, the lowest in the table1.
Because the figure is the date the city closed the account, a cluster of closures in one month can come from a batch of accounts handled together as much as from a cluster of businesses ending. The table does not say which, and this page does not infer it.
Closures by category group and year
The second table counts closed in-city records by the site’s category groups and by year of the closure, 2022 to 2026. The 2026 column covers January through September. The grouping is described on the methodology page and is the site’s, not the city’s.
| Category group | 2022 | 2023 | 2024 | 2025 | 2026 | Total |
|---|---|---|---|---|---|---|
| Professional and office | 490 | 558 | 1,044 | 760 | 613 | 3,465 |
| Property rental | 367 | 400 | 851 | 495 | 383 | 2,496 |
| Retail | 199 | 220 | 497 | 354 | 332 | 1,602 |
| Food and drink | 194 | 209 | 384 | 449 | 343 | 1,579 |
| Other services | 202 | 212 | 375 | 303 | 223 | 1,315 |
| Personal care | 174 | 161 | 333 | 352 | 254 | 1,274 |
| Health and medical | 135 | 153 | 203 | 259 | 147 | 897 |
| Cannabis | 137 | 208 | 131 | 129 | 126 | 731 |
| Construction and trades | 89 | 84 | 196 | 135 | 109 | 613 |
| Arts, fitness and recreation | 47 | 42 | 114 | 114 | 79 | 396 |
| Manufacturing and wholesale | 51 | 50 | 87 | 85 | 66 | 339 |
| Other | 9 | 9 | 20 | 14 | 11 | 63 |
| Sidewalk vending | 7 | 16 | 10 | 33 | ||
| Total | 2,094 | 2,306 | 4,242 | 3,465 | 2,696 | 14,803 |
The yearly totals are 2,094 in 2022 and 2,306 in 2023, then 4,242 in 2024, 3,465 in 2025 and 2,696 through September 2026, 14,803 over the five years1. The 2024 total is nearly double the 2023 total, 4,242 against 2,306. The table does not explain the step; every group except Cannabis has a higher figure in 2024 than in 2023.
Professional and office is the largest group in every year: 490 in 2022, 558 in 2023, 1,044 in 2024, 760 in 2025 and 613 so far in 2026, 3,465 in all1. Property rental is next at 2,496, with 851 in 2024 against 400 in 20231. Retail has 1,602, with 497 in 2024 against 220 in 20231.
Food and drink shows a different pattern from the three groups above it. It has 1,579 closures in all and peaks in 2025 at 449, after 384 in 2024 and 209 in 2023, while Professional and office, Property rental and Retail peak in 2024. Through September 2026 Food and drink has 3431.
Other groups: Other services has 1,315, Personal care 1,274, and Manufacturing and wholesale 3391. Health and medical has 897, with its highest year in 2025 at 2591. Cannabis has 731, a steady count by comparison, between 126 and 208 in each year, with 137 in 2022 and 208 in 20231. Construction and trades has 613, Arts, fitness and recreation 396, Other 63 and Sidewalk vending 33, with no records before 20241.
What to read from it, and what not to
The tables support three plain statements: the city closes a few hundred license accounts in a typical month, the not home-based accounts are the larger share, and the closure count for 2024 is the highest of the five years in the table. They do not support a count of businesses that closed, a closure rate, or a comparison with openings. A rate would need the number of licenses at risk in each period, and the tables do not give one1.
The number of licenses that are Active today is on How Many Businesses Long Beach Has, and the kinds of license that start are on What Kinds of Businesses Open in Long Beach. Starts by district and ZIP are on Where Businesses Open in Long Beach.
Frequently Asked Questions
How many businesses close in Long Beach each month?
The city’s license layer shows between 206 and 370 in-city license accounts closed in a month over the last two years, with 252 in September 2026. A closed account is not necessarily a business that failed1.
Does a closed license mean the business closed down?
Not necessarily. The record is the date the city closed the account, which also happens when a holder moves, stops paying or changes entity1.
Which month had the most closures?
February 2026, with 370 records, followed by April 2026 with 3631.
Which kinds of businesses have the most license closures?
Since 2022, Professional and office has 3,465, Property rental 2,496, Retail 1,602 and Food and drink 1,5791.
Why were there more closures in 2024?
The table shows 4,242 closed records for 2024, against 2,306 for 2023 and 3,465 for 2025, and does not give a reason1.
Are the latest months final?
No. The current month is left out, and the two months before it, August and September 2026, are provisional and can change when the table is refreshed1.
Do home-based licenses close more often than other licenses?
The month table gives both counts. Not home-based closures are the larger figure in every month; home-based ones range from 45 to 1461.
Related Articles
Sources
- Business Licenses Public View — City of Long Beach, MapsLB. Accessed 2026-10-01.
- Terms of Use — City of Long Beach, MapsLB. Accessed 2026-09-30.