In brief
Since January 2018 the City of Long Beach’s license layer shows 33,127 in-city license records with a start date through September 2026, and Professional and office is the largest category group with 7,474. The groups are this site’s, built from the city’s license descriptions, and the counts include every status as of October 1, 2026.
- Largest groups since 2018: Professional and office 7,474, Property rental 4,424, Food and drink 3,765, Retail 3,416 and Cannabis 3,0561.
- Biggest fall: Cannabis starts went from 702 in 2019 to 175 in 20251.
- Professional and office starts went from 1,030 in 2018 to 746 in 2025; Food and drink stayed between 357 and 480 a year1.
- Largest single description among 2025 starts: Apartment House, 379 of the year’s 3,623 records1.
- 2026 is partial, through September, and the sidewalk vending group has no records before 20241.
A Long Beach business license carries a description chosen from several hundred the city uses, from “Restaurant & Ready to Eat Foods” to “Barber/Beauty (booth)”. That list is too long to read as a table, so this page uses a grouping of thirteen categories, defined on How the Long Beach Data Pages Are Made, and shows how many license records started in each group in each year from 2018 to 2026. A second table shows the twenty-five largest individual descriptions among licenses that started in 2025.
For how a business gets a license in the first place, see How to Start a Business in Long Beach. The numbers here are this site’s tallies of the city’s records, used under the MapsLB terms of use, which allow reuse and do not allow any suggestion that the city endorses it2.
Source Business Licenses Public View, City of Long Beach (MapsLB), fetched October 1, 2026; nightly refresh by the city. Period: 2025; Professional and office to Other. Method: In-city licenses by year of start date, grouped from the city’s license description with the site’s category groups; the latest year is partial. The figures are this site’s own tallies of the city’s published records, used under the City of Long Beach’s open-data terms; the city does not endorse this site. How these pages are made.
The short answer
| If you are… | Read this |
|---|---|
| Looking for the biggest category | Professional and office, with 7,474 records started since 20181 |
| Looking for what is shrinking | Cannabis, from 702 records in 2019 to 175 in 20251 |
| Looking for what is steady | Food and drink, between 357 and 480 records in every full year1 |
| Looking for the largest single description in 2025 | Apartment House, with 379 records1 |
| Looking for a category with a late start | Sidewalk vending, with records only from 20241 |
How to read the groups
The groups are the site’s, not the city’s. Each of the city’s license descriptions is placed in one group by keyword, so a count in a group is only as good as that matching. “Property rental” is driven by apartment houses, which each hold a license: Apartment House accounts for 379 of the group’s 416 records in 20251. “Cannabis” holds every cannabis-related description, not only dispensaries1.
Counts are by start date, inside the city, with every status as of October 1, 2026. A license that started in 2019 and has since closed is still a 2019 start. The 2026 column covers January through September, and the current month is left out1. The two months before it are provisional.
New licenses by category group and year
Each row is a group and each column a year of start date. The Total column adds the nine years, and the Total row adds the groups.
| Category group | 2018 | 2019 | 2020 | 2021 | 2022 | 2023 | 2024 | 2025 | 2026 | Total |
|---|---|---|---|---|---|---|---|---|---|---|
| Professional and office | 1,030 | 1,049 | 1,018 | 836 | 756 | 689 | 696 | 746 | 654 | 7,474 |
| Property rental | 675 | 539 | 414 | 467 | 442 | 534 | 529 | 532 | 292 | 4,424 |
| Food and drink | 416 | 468 | 380 | 357 | 415 | 480 | 427 | 432 | 390 | 3,765 |
| Retail | 446 | 414 | 497 | 439 | 387 | 325 | 317 | 344 | 247 | 3,416 |
| Cannabis | 613 | 702 | 550 | 262 | 380 | 171 | 148 | 175 | 55 | 3,056 |
| Other services | 425 | 382 | 306 | 315 | 331 | 283 | 308 | 368 | 271 | 2,989 |
| Personal care | 421 | 387 | 254 | 255 | 269 | 183 | 232 | 306 | 256 | 2,563 |
| Health and medical | 228 | 175 | 183 | 239 | 207 | 203 | 200 | 213 | 146 | 1,794 |
| Construction and trades | 162 | 197 | 157 | 141 | 146 | 155 | 123 | 130 | 111 | 1,322 |
| Arts, fitness and recreation | 125 | 122 | 109 | 112 | 125 | 115 | 106 | 109 | 86 | 1,009 |
| Manufacturing and wholesale | 108 | 106 | 85 | 64 | 72 | 70 | 116 | 91 | 59 | 771 |
| Sidewalk vending | 179 | 169 | 100 | 448 | ||||||
| Other | 11 | 10 | 11 | 15 | 9 | 9 | 14 | 8 | 9 | 96 |
| Total | 4,660 | 4,551 | 3,964 | 3,502 | 3,539 | 3,217 | 3,395 | 3,623 | 2,676 | 33,127 |
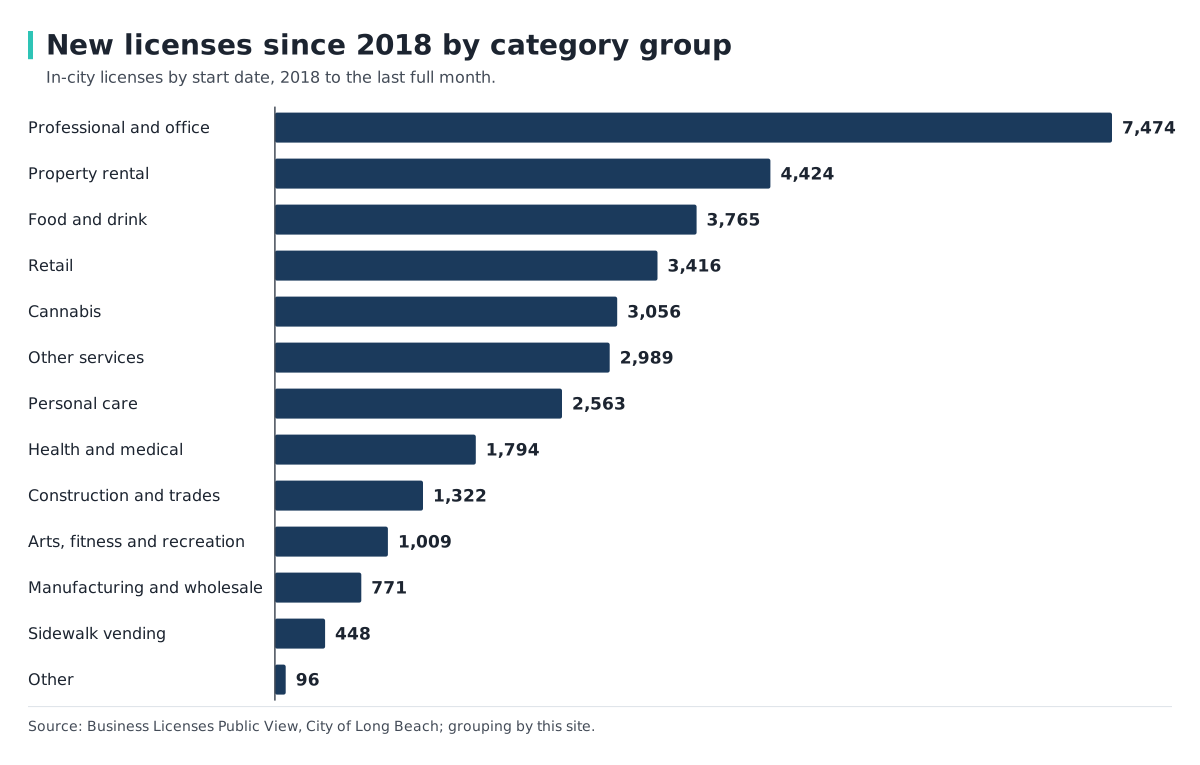
The chart shows the Total column of the table, one horizontal bar per group.
The largest group is Professional and office, with 7,474 records, more than any other group by a wide margin: Property rental is second with 4,424, Food and drink third with 3,765 and Retail fourth with 3,4161. Cannabis has 3,056, Other services 2,989 and Personal care 2,5631. Manufacturing and wholesale has 771, Health and medical 1,794, Construction and trades 1,322, Arts, fitness and recreation 1,009, Sidewalk vending 448 and Other 961.
What changed from year to year
Professional and office is the largest group and has declined since the first two years of the table. It started 1,030 records in 2018 and 1,049 in 2019, fell to 836 in 2021 and 689 in 2023, and reached 746 in 2025. The 2026 figure so far is 6541.
Cannabis shows the sharpest decline of any group. It has 613 records in 2018 and peaks at 702 in 2019. It then drops to 262 in 2021 and 171 in 2023, and reaches 148 in 2024 and 175 in 2025, with 55 so far in 20261. The group counts every cannabis description, so a single operator holding several licenses adds several records1.
Food and drink is the steadiest large group. Its range over the eight full years is 357 (2021) to 480 (2023), with 432 in 2025 and 390 so far in 20261.
Retail moved from 446 in 2018 and a peak of 497 in 2020 to 325 in 2023 and 317 in 2024, then recovered slightly to 344 in 20251. Personal care is lowest in 2023 at 183 and highest in 2018 at 421, with 306 in 20251. Property rental ranges from 414 in 2020 to 675 in 2018, and stands at 532 in 20251.
Sidewalk vending has no records in the table before 2024. It then shows 179 in 2024, 169 in 2025 and 100 so far in 20261. The table does not say why the group begins in 2024.
Across all groups the yearly totals are 4,660 in 2018, 3,217 in 2023 and 3,623 in 2025, with 2,676 through September 20261. The 2026 column is partial, so a 2026 figure should be set against nine months of another year, not against its full total.
The largest descriptions among 2025 starts
The second table drops the grouping and lists the city’s own descriptions. It shows the twenty-five largest among licenses that started in 2025, in the city’s wording.
| City’s license description | Licenses started in 2025 |
|---|---|
| Apartment House | 379 |
| Business Office | 190 |
| Consulting | 168 |
| Restaurant & Ready to Eat Foods | 147 |
| Internet Sales/Service | 144 |
| Sidewalk Vending – Food | 128 |
| Retail Sales | 125 |
| Commercial/Industrial Space Rental | 116 |
| Barber/Beauty (booth ) | 111 |
| Professional Services – Other | 89 |
| General Services – Other | 87 |
| Medical Office/Clinic | 75 |
| Catering/Party Consulting | 74 |
| Barber/Beauty Shop Owner | 68 |
| Cottage Food Operation | 60 |
| Restaurant & Ready to Eat Foods with Alcohol | 55 |
| Tattoos/Body Piercing | 51 |
| Mobile Services – Misc. | 45 |
| Food Retail Store | 44 |
| Contracting – Building | 43 |
| Attorney | 42 |
| Sidewalk Vending – Merchandise | 41 |
| Accounting | 36 |
| Janitorial Service | 36 |
| Psychology | 33 |
Apartment House leads with 379 records, against 3,623 started in the year across all groups1. Business Office follows with 190, Consulting with 168, Restaurant & Ready to Eat Foods with 147 and Internet Sales/Service with 1441.
The sidewalk vending descriptions appear twice: Sidewalk Vending – Food has 128 records and Sidewalk Vending – Merchandise has 411. Commercial/Industrial Space Rental has 116 and Retail Sales 1251. The hair and beauty descriptions are split between Barber/Beauty (booth) at 111 and Barber/Beauty Shop Owner at 681.
Food businesses appear under several descriptions: Catering/Party Consulting with 74, Cottage Food Operation with 60, Restaurant & Ready to Eat Foods with Alcohol with 55 and Food Retail Store with 441. Professional descriptions include Professional Services – Other at 89, Attorney at 42 and Accounting at 36, and the table closes with Psychology at 331.
Two of the largest descriptions are landlord or leasing licenses rather than operating businesses: Apartment House with 379 and Commercial/Industrial Space Rental with 1161. A reader looking for the number of businesses that opened should set those aside, because they count buildings and leases.
What this page does not say
The tables do not show which of these licenses are still open, how long a business lasts or how many started as renewals of older accounts. Closures are on Business License Closures in Long Beach by Month and Category, and the same starts by month and year are on New Business Licenses in Long Beach, Month by Month. Starts by council district and ZIP are on Where Businesses Open in Long Beach. The count of licenses that are Active today is on How Many Businesses Long Beach Has.
Frequently Asked Questions
What kinds of businesses open most often in Long Beach?
By license records since 2018, Professional and office leads with 7,474, then Food and drink with 3,765 and Retail with 3,4161.
Why did cannabis licenses fall?
The table shows the fall, from 702 records in 2019 to 175 in 2025, and does not give a reason1.
What is the most common new license description in 2025?
Apartment House, with 379 records. Business Office is second with 190 and Consulting third with 1681.
How many new business licenses started in Long Beach since 2018?
33,127 in-city records have a start date from January 2018 through September 2026, as of October 1, 20261.
Are the category groups the city's?
No. The groups are this site’s, assigned from the city’s license descriptions by keyword, and the descriptions are the city’s1.
Why is there no sidewalk vending count before 2024?
The table has no records in that group for 2018 through 2023. It has 179 in 2024, 169 in 2025 and 100 in 2026 so far1.
Related Articles
Sources
- Business Licenses Public View — City of Long Beach, MapsLB. Accessed 2026-10-01.
- Terms of Use — City of Long Beach, MapsLB. Accessed 2026-09-30.