In brief
Over the last two years the City of Long Beach’s license layer shows between 177 and 603 license records starting in a single month, with 262 starting in September 2026 and 236 in August 2026. These are in-city records counted by start date, all statuses, as of October 1, 2026, and they count licenses rather than storefronts.
- Busiest month in the table: July 2025, 603 records; July 2026 follows at 433, and January reaches 419 in 2025 and 394 in 20261.
- Quietest month in the table: December 2024, 177 records, followed by September 2025 at 1981.
- By year: 4,660 records started in 2018, 3,217 in 2023 and 3,623 in 2025; 2,676 have started in 2026 through September1.
- Home-based records numbered 985 of the 3,623 starts in 2025; the other 2,638 were not home-based1.
- Recent months are provisional: in September 2026, 165 of 262 records were still Pending and 90 were Active1.
Every month the City of Long Beach adds a few hundred records to its business license register, and the register is public. This page tallies them: how many license records started in each of the last twenty-four months, how many of those are Active or Pending today, and how many started in each year from 2018 to 2026. The section pillar, How to Start a Business in Long Beach, covers what a person does to get one of these licenses; this page counts the result.
The count is of licenses, and a license is not always a new business. A landlord’s apartment house holds one, a company can hold several, and a home-based consultant holds one. The definitions behind every figure, including how a “new” license is told apart from a renewal, are on How the Long Beach Data Pages Are Made. The figures here are this site’s own tallies of the city’s records, used under the MapsLB terms of use, which allow reuse of the data and do not allow any suggestion that the city endorses the reuse2.
Source Business Licenses Public View, City of Long Beach (MapsLB), fetched October 1, 2026; nightly refresh by the city. Period: 2018 to 2026; October 2024 to September 2026. Method: Licenses located in Long Beach (OUTSIDECITY = No) counted by the month of their start date (ISSDTTM); the current month is left out because the layer backfills, and the two previous months change on each refresh. The yearly table splits the same records by the home-based flag the city records on each license. The figures are this site’s own tallies of the city’s published records, used under the City of Long Beach’s open-data terms; the city does not endorse this site. How these pages are made.
The short answer
| If you are… | Read this |
|---|---|
| Looking for how many license records started in a given month | The month table below; the latest full row is September 2026, with 262 records1 |
| Looking for the busiest and quietest months | July 2025 at 603 records and December 2024 at 177 are the two ends of the table1 |
| Comparing one year with another | The year table; 2018 has 4,660 records and 2025 has 3,623, and 2026 is partial through September1 |
| Asking whether the latest month is final | No. The current month is left out and the previous two months are provisional1 |
| Asking how many of the new licenses are home-based | The year table splits every year into home-based and not home-based1 |
What counts as a new license
A record is counted in the month of its start date, the field the city’s layer labels “Start Date”. That is the date the license took effect, not the date someone applied, and the city can set it ahead of the calendar1. For that reason the tables leave out the current month, October 2026, entirely.
Only records located inside Long Beach are counted. The layer also holds licenses for contractors and vendors based elsewhere who work in the city; they are left out of these tables and appear on How Many Businesses Long Beach Has1.
Every status counts. A license that started in March 2025 and has since gone inactive is still a March 2025 start. The month table separates the records into Active, Pending and “Other status”, which holds every status other than those two1. The statuses are the city’s labels as of October 1, 2026, not the status each record had in the month it started.
New licenses by month
The table covers the twenty-four months from October 2024 to September 2026. Each row gives the number of in-city records that started that month and how they are labeled today.
| Month | Active | Pending | Other status | Total |
|---|---|---|---|---|
| 2024-10 | 136 | 68 | 85 | 289 |
| 2024-11 | 100 | 60 | 65 | 225 |
| 2024-12 | 83 | 31 | 63 | 177 |
| 2025-01 | 207 | 107 | 105 | 419 |
| 2025-02 | 144 | 44 | 64 | 252 |
| 2025-03 | 157 | 79 | 90 | 326 |
| 2025-04 | 135 | 72 | 106 | 313 |
| 2025-05 | 89 | 67 | 74 | 230 |
| 2025-06 | 129 | 88 | 69 | 286 |
| 2025-07 | 401 | 87 | 115 | 603 |
| 2025-08 | 89 | 63 | 101 | 253 |
| 2025-09 | 106 | 58 | 34 | 198 |
| 2025-10 | 176 | 76 | 52 | 304 |
| 2025-11 | 128 | 68 | 21 | 217 |
| 2025-12 | 140 | 62 | 20 | 222 |
| 2026-01 | 227 | 122 | 45 | 394 |
| 2026-02 | 145 | 75 | 16 | 236 |
| 2026-03 | 127 | 97 | 37 | 261 |
| 2026-04 | 169 | 110 | 12 | 291 |
| 2026-05 | 153 | 109 | 27 | 289 |
| 2026-06 | 128 | 121 | 25 | 274 |
| 2026-07 | 245 | 161 | 27 | 433 |
| 2026-08 | 104 | 119 | 13 | 236 |
| 2026-09 | 90 | 165 | 7 | 262 |
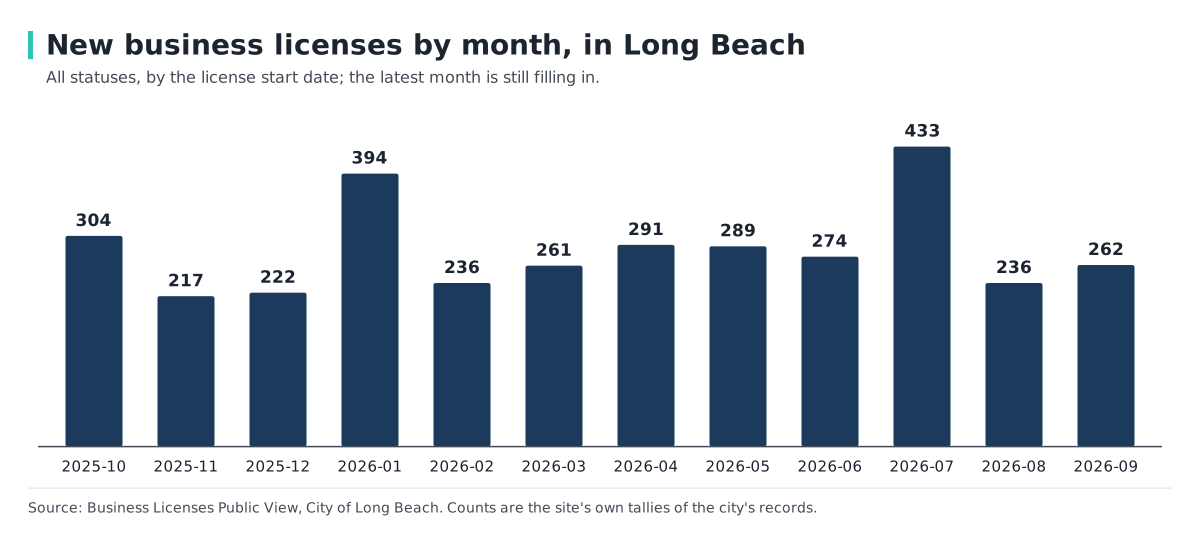
The chart repeats the last twelve full months of the table, October 2025 through September 2026, as one bar per month.
The table has two peaks a year. July 2025 is the highest month at 603 records, of which 401 are Active, and July 2026 is the next highest at 433 records. January is the other high point: 419 records in January 2025 and 394 in January 20261. The table does not say why those two months run higher than the rest, and this page does not guess.
The lowest months are December 2024, with 177 records, and September 2025, with 1981. Outside the January and July peaks, the other ten months of the chart run from 217 in November 2025 to 304 in October 20251.
The latest row is September 2026, with 262 records. The same month a year earlier, September 2025, had 1981. Because September 2026 is one of the two provisional months, that gap can change when the table is refreshed.
Reading the status columns
The three status columns are the part of the table most affected by when the data was fetched. In the oldest months, the Active column is the largest, and the Other status column holds records that have since lapsed: 85 of the 289 records that started in October 2024, and 115 of the 603 that started in July 20251.
In the newest months the pattern reverses. August 2026 has 104 Active records and 119 Pending, and September 2026 has 90 Active and 165 Pending, out of a total of 2621. Other status is small in those rows, 13 in August 2026 and 7 in September 2026, because there has been little time for a record to lapse1.
Two things follow from reading the columns together. First, a Pending record has not yet reached the Active label, so the Active count for a recent month is not comparable with the Active count for an old one. Second, because of that, the Total column is the figure that can be compared across months1.
New licenses by year
The year table runs from 2018 to 2026 and splits every year into home-based and not home-based records. The 2026 row is partial: it covers January through September only.
| Year | Home-based | Not home-based | Total |
|---|---|---|---|
| 2018 | 1,046 | 3,614 | 4,660 |
| 2019 | 1,149 | 3,402 | 4,551 |
| 2020 | 1,344 | 2,620 | 3,964 |
| 2021 | 1,114 | 2,388 | 3,502 |
| 2022 | 918 | 2,621 | 3,539 |
| 2023 | 907 | 2,310 | 3,217 |
| 2024 | 876 | 2,519 | 3,395 |
| 2025 | 985 | 2,638 | 3,623 |
| 2026 | 808 | 1,868 | 2,676 |
The year totals fall from 4,660 in 2018 and 4,551 in 2019 to 3,964 in 2020, 3,502 in 2021 and 3,539 in 2022. The low point is 2023, at 3,217. Totals then rise to 3,395 in 2024 and 3,623 in 20251.
Most of the movement is in the not home-based column. It starts at 3,614 in 2018, falls to 2,310 in 2023 and recovers to 2,638 in 20251. The home-based column moves in a narrower range: 1,046 in 2018, a peak of 1,344 in 2020, 907 in 2023 and 985 in 20251.
The 2020 row is the only one in which the not home-based count is less than twice the home-based count: 2,620 not home-based against 1,344 home-based1. In every other row, the table shows the not home-based count at more than twice the home-based one.
The 2026 row, 2,676 records through September, cannot be compared with a full year. The comparison the table supports is the 2025 row, 3,623, against the nine months of 2026, 2,6761.
What the tables leave out
The tables do not show which businesses opened, where they are or what they sell; those breakdowns are on New Business Licenses by Category Group and New Business Licenses by Council District and ZIP. They do not subtract closures, which are on Business License Closures in Long Beach, so a month’s new records are not a net gain in anything. They do not include licenses for businesses located outside the city, and they do not estimate the number of businesses that never apply1.
The cost of the license itself, set by category, is on What a Long Beach Business License Costs.
Frequently Asked Questions
How many new businesses open in Long Beach each month?
The city’s license layer shows between 177 and 603 in-city license records starting in a month over the last two years, with 262 in September 2026 and 236 in August 2026. These are licenses by start date, not a count of storefronts1.
How many new business licenses started in Long Beach in 2025?
The layer shows 3,623 in-city records with a 2025 start date, 985 home-based and 2,638 not home-based, as of October 1, 20261.
Which month had the most new licenses?
July 2025, with 603 records, is the highest month in the twenty-four-month table; July 2026 is second at 4331.
Is a new license the same as a new business?
No. The layer counts license accounts. One company can hold several, and landlords hold licenses for apartment houses and rental space, so a new record is not always a new business1.
Why do the latest months show so many Pending licenses?
In September 2026, 165 of the 262 records were Pending and 90 were Active. The statuses are the city’s labels on the fetch date, and recent records have had the least time to move to Active1.
Why is the 2026 figure lower than 2025?
The 2026 row is partial. It holds 2,676 records through September, while the 2025 row holds 3,623 for the full year1.
Does the table include licenses held by businesses outside Long Beach?
No. Records for licensees located outside the city are left out of the new-license tables1.
Related Articles
Sources
- Business Licenses Public View — City of Long Beach, MapsLB. Accessed 2026-10-01.
- Terms of Use — City of Long Beach, MapsLB. Accessed 2026-09-30.